 
 The LUHNA Book!
|

  |
|
by
Timothy W. Foresman
Abstract. Land-use history studies in the Baltimore-Washington region provide the framework for a variety of environmental studies and regional partnerships. Multiple Federal and local agencies cooperated on a 200-year urban growth study in the Chesapeake region that led to the creation of the Baltimore-Washington Regional Collaboratory. Understanding of the contemporary landscapes is being sought through investigations of land-use and landcover dynamics using the technologies of geographic information systems (GIS), remote sensing, and environmental modeling. Data are being collected by many local, State, and Federal groups and then processed and organized into a GIS and made available to the public through the Collaboratory's web site (http://www.umbc.edu/bwrdc). Results of the land-use history research have been presented in a video that was cited by Maryland's Governor Parris Glendening for influencing the legislature to promote the State's "Smart Growth" initiatives. A series of follow-on activities resulting from the success of the Collaboratory's land-use history research efforts includes the National Science Foundation's Urban Long-Term Ecological Research site for Baltimore, a forest fragmentation study with the U.S. Forest Service, the urban-rural index with the Bureau of the Census, and cellular automaton model development. Land-use history has proven to be the catalyst for integrating and communicating the complex issues of linkages between physical, ecological, and social processes that compose the human ecosystem.
Urbanization is now recognized as a ubiquitous phenomenon of global importance. As cities grow, they expand over agriculture, wetlands, wildlands, and forests, thereby changing the physical shape of the landscape as well as the functioning state of the ecosystem (Vitousek 1994). We are learning that these physical and ecological changes also may have profound impacts on shaping the social character of our cities, suburbs, and rural areas. As the largest estuary in the United States, the Chesapeake Bay is well known for its ecological diversity and rich historical and economical significance to the nation. The Chesapeake Bay region has been mapped and studied since European settlement, and because of both its history and the records kept by government agencies and historians, a wealth of information is available to researchers. For the past 25 years, environmental research efforts have focused on tracking nonpoint source pollution and the processes involved with the bay's over-nutrification. Since the mid-1980's, with the tremendous urban and suburban growth that has occurred, large patches of vegetated land cover are rapidly disappearing. Techniques that will integrate the Chesapeake Bay region's wealth of data in order to support better decision making and improve land management policies and planning are necessary under the extensive pressures of urbanization and population growth. Collaboration bringing together data from scientists, researchers, local land managers, and decision makers is needed to effectively study these cumulative impacts on the bay's living resources and watershed. The Baltimore-Washington Regional Collaboratory (the Collaboratory) is developing innovative ways to create user-friendly Internet web sites, useful map products, and advanced visualization tools to portray the dynamic nature of the region's historic land-use and landcover patterns and trends. The Collaboratory represents multiple partnerships between local groups and county, State, and Federal agencies to share spatial data. The scientific goals of this research program are:
The mission of the Collaboratory is to demonstrate the feasibility and utility of providing scientifically valid data in an easily understandable format to the general public and decision makers. The data provided through the Collaboratory include historic, comprehensive, and detailed information that is compiled into a spatial framework with geographic information systems (GIS) technology. These data sets are part of a comprehensive research program sponsored by the National Aeronautics and Space Administration (NASA) and the National Science Foundation (NSF) and aimed at both quantifying the geography and ecology of the Chesapeake Bay region and delivering this information via an Internet clearinghouse. The Collaboratory also seeks to apply these data to community outreach activities with citizens, scientists, and managers.
As part of the Collaboratory's research program, the University of Maryland, Baltimore County (UMBC) in cooperation with NASA, the U.S. Census Bureau, and the U.S. Geological Survey (USGS) have been developing computer-based methods for collecting and integrating historic mapping and census records to study changes on the landscape over the past 200 years. The Collaboratory built a regional GIS as part of a cooperative study of human-induced land transformations. This study encompasses a 2 latitude by 2 longitude region (38 N 76 W to 40 N 78 W) focusing on the metropolitan areas of Baltimore, Maryland, and Washington, D.C. (Fig. 5-1). An interdisciplinary, multiple-agency team compiled information on principal transportation, urban development, hydrography, topography, and census data (Clark et al. 1996; Crawford et al. 1996). A USGS team had previously developed methodology for integrating these types of data for a study of the San Francisco Bay (Kirtland et al. 1994), and their methods were adapted to organize and spatially reference (in GIS format) the database for the entire Baltimore-Washington study region. Eight images were generated to portray the urban growth from 1792 to 1992 (Fig. 5-2). Urban land-use and transportation compilations were accomplished using manual map transcriptions, table digitizers, and, beginning with the 1972 data, digital image processing of satellite scenes. The criteria for defining urban areas was established as a population of 500 persons. Census information, obtained from historic census records, was correlated with historic maps to determine the locations and boundaries of each urban area. This information was then formatted, input to a GIS, and placed on the Collaboratory's web site (http://www.umbc.edu/bwrdc) for public access. From these eight images, we can recount the settlement patterns that transformed the mosaic of native deciduous forest to the familiar fragmented landscapes of today (Zipperer 1993).
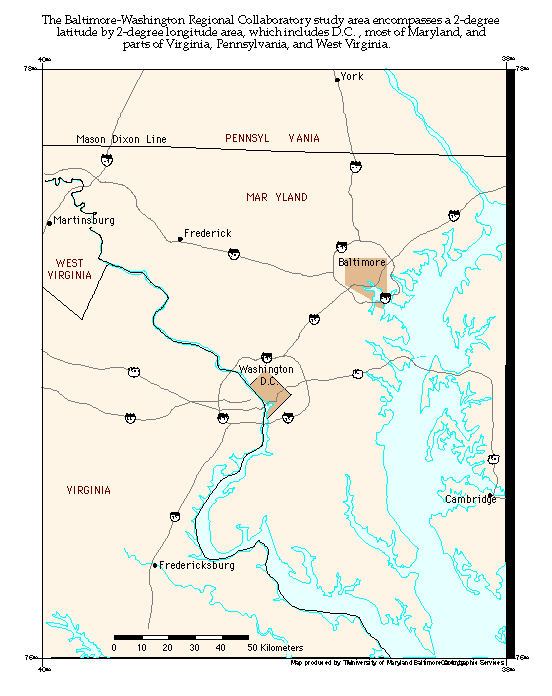 Fig. 5-1. Study area for the Baltimore-Washington Regional Collaboratory. After a century and a half of colonial development, urban patterns begin to show up around the ports of Annapolis, Baltimore, and Alexandria (Fig. 5-2). These ports represent the primary centers of trade and development. Colonial towns were often situated along the fall line, where ocean-going shipping ended and water power could be harnessed to run grain mills and basic manufacturing operations. By the mid-nineteenth century, Baltimore was the region's bustling urban and industrial center, with approximately 1 million people in the Baltimore-Washington region. A network of rural mill villages operated along the major tributaries of the Patapsco, Jones Falls, and Gwynns Falls valleys. Two million people began to form an expanded suburban environment at the turn of the twentieth century with the advent of street cars and rail line extensions. Lack of bridge infrastructure limited growth in northern Virginia and in the "corridor" between Baltimore and Washington. By the 1920's, the "inter-urban" rail infrastructure enabled commuter traffic to bring suburban village workers to the urban core of the cities. Corridors of urban growth seemed to follow these major commuter rail paths from both Baltimore and Washington. By the mid-twentieth century, the effects of growth could be easily seen, beginning with the Federal government's expansion during the 1930's and 1940's to the post-World War II population growth. Fertilizer use on lawns and agriculture was beginning to have a demonstrable impact on the bay's ecosystems during this period, and that impact was exacerbated by loss of more forest land. Automobiles, roads, and bridges significantly accelerated the expansion of the urban work force into the rural communities, creating the need for a suburban market infrastructure (i.e., the creation of towns for housing, food, and supply materials). Beginning in 1972 and expanding through the next two decades, urban land use filled in the Baltimore and Washington corridor, forming seeds for the megalopolis (Von Eckardt and Gottman 1964). By 1992, more than 8 million people lived in the study region. This fast-paced growth, combined with urban flight into the previously rural landscape, transformed the critical hydrologic buffers of forest and wetlands, causing increased sediment and pollution loading into the bay.
 Fig. 5-2. Two hundred years of urban growth for the Baltimore-Washington region. Red pixels denote urban land use as defined by both the USGS and the Bureau of the Census.
Visualization techniques and simulated landscapes are also helping scientists and citizens understand the complex effects of land-use management on land cover. The Collaboratory's regional GIS data can be applied to analyze more details regarding the growth stages in urbanization impact studies. For example, vegetation ecologists are investigating how land-use processes influence landcover dynamics. Landsat satellite images of undisturbed deciduous forest canopy draped over the Baltimore terrain were used to portray predevelopment conditions (Masuoka et al. 1996; Fig. 5-3). The growth in urban land use was then overlaid as yellow boundaries to indicate where deforestation and agricultural lands have been displaced by urban activities. In the earlier perspectives, the port of Baltimore shows as the major urban center, along with the town of Westminster to the northwest, which was then an agricultural transshipment center. A century later, the expansion of market towns and transshipment centers is visible in the images, as are developing suburbs. Subsequent deforestation and overuse of agricultural fields resulted in heavy siltation, making many colonial-era ports inaccessible to shipping. The Baltimore and Ohio (B & O) Railroad line runs west from Baltimore, fostering growth in that direction. By 1925, "inter-urban" rail transportation had fostered the development of radial branches from themetropolitan center in a star-like pattern. Then, in just 25 more years, the population almost doubled, due to the defense-related industries of World War II, filling out the star branches connecting suburban areas to the central city over an improved transportation system. By 1972, suburban sprawl had filled in along the south-to-north transportation corridors. By 1992, the rampant growth of the 1980's and continued urban flight from both the central city and the older suburbs had transformed the region's once forested landscape into a single megalopolis connecting Baltimore and Washington to the south.
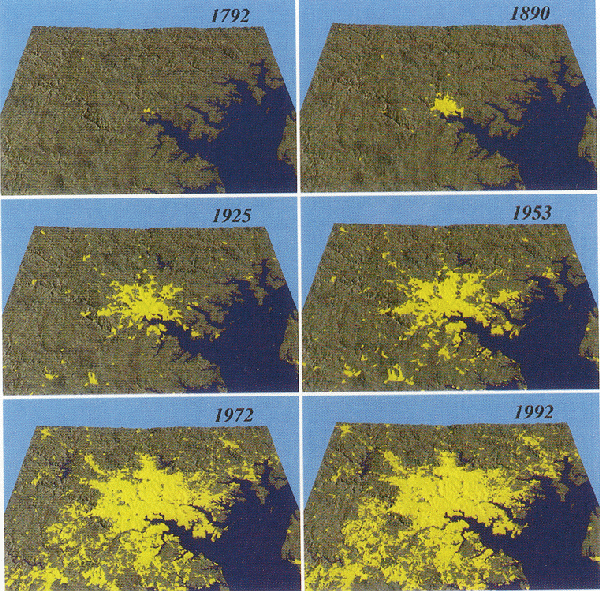 Fig. 5-3. Baltimore simulated forest land cover showing 200 years of urban growth in yellow. Scientists can use these historic GIS-formatted data layers to recreate and model the forest's capacity to intercept precipitation, filter atmospheric gases, cycle nitrogen, and support biodiversity (Foresman et al. 1996). Extensive field work using the techniques of paleoecologists, that is, sediment core analysis and analysis of historic records, is required to improve the scientific validity of the regional GIS data sets (Table 5-1). Through the work of paleoecologists, the Collaboratory is building a definitive picture of the land-use and landcover histories that characterize the Chesapeake region for the pre- and post-European settlement periods. The paleoecological records provide important clues to the effects of land clearing on sediment and nutrient loading rates for the Chesapeake Bay (Brush 1994). Land clearing had reached 20-30% by the time of the country's independence. Deforestation increased significantly due to both land clearing activities for tobacco and wheat farming and the fuel requirements for the numerous iron works that preceded the industrial revolution. By the end of the nineteenth century, 60-80% of the land had been cleared, and soil processes had been disrupted with the advent of deep plowing and fertilization practices; both were key factors in accelerating the bay's nutrification and siltation. The twentieth century has witnessed a significant reduction of ecological buffer systems for the bay with the loss of forest acreage, drainage of wetlands, and decrease in permeable surfaces. Quantifying these impacts with attention to the exact locations of past land-use management is a central part of the Collaboratory's research agenda.
The Baltimore-Washington Regional Collaboratory's land-use history research has led to a comprehensive research program in partnership with the U.S. Forest Service (USFS), Johns Hopkins University (JHU), the Institute of Ecosystem Studies (IES), and others. A brief description of these research activities will demonstrate the critical importance of improved understanding land-use history in assessing, predicting, and managing the nation's ecological resources, in the face of expanding human activities.
The National Science Foundation's Long-Term Ecological Research (LTER) program has awarded an Urban LTER grant for an interdisciplinary team of investigators housed on the UMBC campus. The Baltimore Urban LTER project is using the Collaboratory's regional data base as the foundation for long-term studies of the interactions or flux measurements between physical, ecological, and social systems along an urban-rural gradient within the Gwynns Falls watershed (Fig. 5-4). An important feature of these research activities is the incorporation of educational links with area schools to involve students in the field collection and analysis activities, thereby offering enhancement to existing school curricula for math and the sciences. An example of these educational links is a partnership with local high schools to collect field data in forest patches that have been delineated by the UMBC scientists for validation and calibration of satellite sensors. Field data collection techniques have been developed and tested with high school educators and students in cooperation with foresters and ecologists from the USFS and Maryland Department of Natural Resources (DNR). The Collaboratory maintains a web site for access to the LTER research activities and data (http://baltimore.umbc.edu/lter).
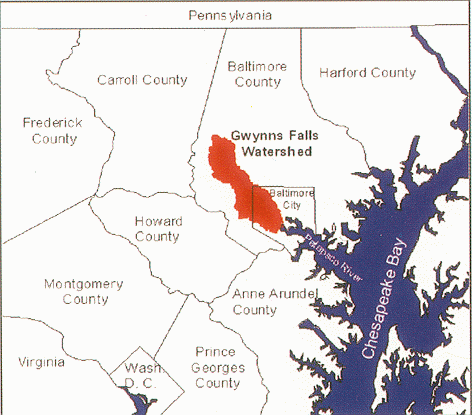 Fig. 5-4. Baltimore Long-term Ecological Research, Gwynns Falls watershed location map.
The Collaboratory's research includes investigations into the application and validation of landcover characterization using remote sensing technology. The NASA Office of Mission to Planet Earth has sponsored the Collaboratory's research in assessing the spatial accuracy and best methods in applying remotely sensed data at resolutions ranging from 1 m to 1 km. Forest patch delineations are used to study the effectiveness of using different spatial resolutions (Fig. 5-5). These studies are important for determining which data and information systems (i.e., which sensors) are the most appropriate for different natural resource decision-making scenarios. Generally, finer resolution satellite data or aerial photography are used to characterize small areas on the ground, while coarser satellite data are used for entire regions. These investigations seek to provide qualitative results so that decision makers can more effectively choose from the suite of increasingly sophisticated data providers (i.e., NASA, other government agencies, and commercial vendors).
 Fig. 5-5. Spatial analysis for forest patch map comparison for Landsat-derived classification (30-m resolution) versus digital ortho quarter quad classification (1-m resolution).
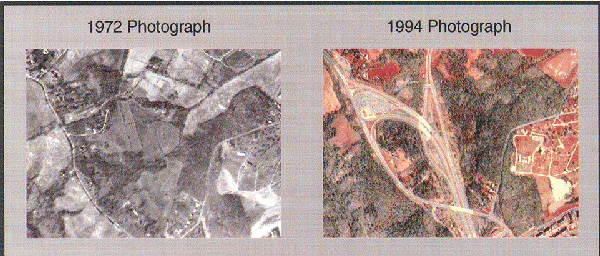 Fig. 5-6. Temporal analysis of land cover using 1972 and 1994 photos of the University of Maryland, Baltimore County campus. Historical Land Use and Population Meticulous research into historical deeds, land records, zoning maps, and demographic or census records can provide important clues to the links between land-use and landcover dynamics. Using today's digital records, Collaboratory researchers are working at the level of individual land parcels for all of Maryland. As investigations become retrospective, the level of detail begins to diminish. However, a sufficient amount of information exists for the Chesapeake region to reconstruct large land holdings and correlate these land ownership records with census tabulations that begin in the seventeenth century. For national-level land use history studies, the county unit offers a fundamental organizing framework enabling county-level comparisons throughout the nation (Fig. 5-7 and see Chapter 2, this volume). The Collaboratory is conducting data collection activities at much finer resolution (i.e., parcel-level) for the counties surrounding Baltimore.
 Fig. 5-7. Baltimore-Washington regional population density, by county, for 1800, 1890, and 1990. Land-use and population data are being investigated under two additional Collaboratory research projects. An urban-rural index (URI) is being created in cooperation with the U.S. Bureau of the Census to quantify the gradient from the inner city urban core to the rural extremes. Research on the URI is intended to provide a national index that defines levels along the gradient, thereby enabling quantitative comparisons for human impacts in areas of extreme environmental difference (e.g., desert versus tundra). Another research project is developing a cellular automaton model (a grid-based growth model) that will predict land-use futures under varying scenarios of transportation planning, population growth, and zoning. Over the past few years, cellular automata models have demonstrated great promise for assisting geographers and Earth scientists in understanding urban growth (Couclelis 1985; Clarke et al. 1997). All of these research activities will generate new information on land-use history for use by citizens, regional planners, and the scientific community.
Improved understanding of land-use history provides the much needed perspective of examining past changes and trends in order to both comprehend and predict our future on the planet. Interagency cooperation, regional spatial data clearinghouses, and Internet-accessible information resources are important long-term investments to support generation of easily understood maps and information describing land-use changes and the effects of human activities on the physical, ecological, and social components of human-dominated ecosystems. Technological innovations for GIS, remote sensing, environmental modeling, and visual presentation methods offer credible scientific tools to harness the myriad land-use and landcover data and to make sense of these complex data for laypersons and scientists. Scientists can now begin to quantify the rates of change and magnitude of these changes for whole regions. At the same time, these tools promote the use of easily understood maps and visualization models to more effectively connect with the citizens and decision makers who control the day to day land management activities. State executives have adapted quickly to the use of these tools in leading Maryland towards improved growth management. As students become exposed to this information through the media and within school curricula, the next generation is being trained to address the many challenges associated with rampant population growth and patterns of urbanization. A quantitative approach is requisite for our struggle to identify key environmental problems, to predict the outcome of our current or planned development actions, and to restructure our natural resource management priorities to anticipate social, physical, and ecological consequences. An improved understanding of land-use history establishes a foundation from which to interpret diverse data sets and foster cooperation in our quest to understand global land-use and landcover changes and to develop coping mechanisms to adapt to these changes. The focus of the LUHNA program is understanding the past and is the key for our journey to the future.
This figure was included in the original version of this paper, however it was not used in the official publication "Perspectives on the Land Use History of North America: A Context for Understanding Our Changing Environment". It is included here as an additional reference.
(mpeg format) 1095 K
NASA Mission to Planet Earth grants NAGW 5040 and NAGW 5070 and the National Science Foundation have supported this research. A USGS research team, under the leadership of L. Gaydos, was instrumental in the concepts and cooperated in the research activities for the 200-year regional study. Regional data collection and analysis were provided in part by J. Tilley and S. Crawford from the USGS. K. Clarke provided support for work on the cellular automata models. W. Zipperer of the U.S. Forest Service collaborated on the forest fragmentation research. I wish to thank professor G. Brush of Johns Hopkins University and M. Ratcliffe of the U.S. Bureau of the Census for their willingness to share their research.
Historical Landcover Changes in the Great Lakes Region
Text-only |
||||||||||||||||||||||||||||||||||