|
||
|
Greenland J. E. Box1, J. Cappelen2, D. Decker1, X. Fettweis3,6, T. Mote4, M. Tedesco5 and R. S. W. van de Wal6 1Byrd Polar Research Center, The Ohio State University, Columbus, Ohio October 19, 2010 Summary Greenland climate in 2010 is marked by record-setting high air temperatures, ice loss by melting, and marine-terminating glacier area loss. Summer seasonal average (June-August) air temperatures around Greenland were 0.6 to 2.4°C above the 1971-2000 baseline and were highest in the west. A combination of a warm and dry 2009-2010 winter and the very warm summer resulted in the highest melt rate since at least 1958 and an area and duration of ice sheet melting that was above any previous year on record since at least 1978. The largest recorded glacier area loss observed in Greenland occurred this summer at Petermann Glacier, where 290 km2 of ice broke away. The rate of area loss in marine-terminating glaciers this year (419 km2) was 3.4 times that of the previous 8 years, when regular observations are available. There is now clear evidence that the ice area loss rate of the past decade (averaging 120 km2/year) is greater than loss rates pre-2000. Coastal surface temperatures A clear pattern of exceptional and record-setting warm air temperatures is evident at long-term meteorological stations around Greenland (Table GL1). For instance:
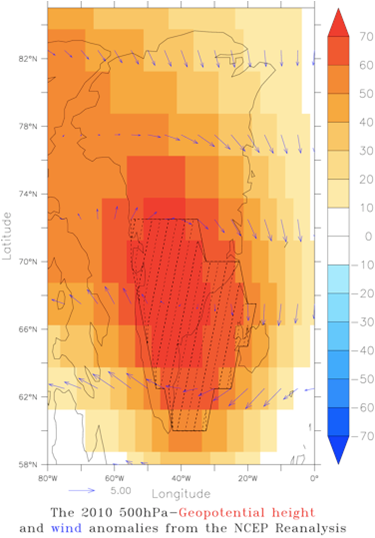
Warming was greatest in Winter (December-February), with temperatures 3.8°C to 8.8°C above the 1971-2000 baseline. The only cooler-than-normal air temperatures were in the winter in east Greenland and are not statistically significant. Winter warming is relevant to increased summer melt because warmed snow or ice volumes require less heat to be brought to the melting point. Under these conditions, melt onset occurs earlier than normal and the snow cover duration is shorter. This leads to a lower average albedo earlier in the summer, allowing for a greater absorption of solar energy, more melting and higher temperatures, especially on land once snow cover is completely melted and exposes bare (dark) land. The "ice-albedo" feedback, responsible for amplified warming in the high latitudes is clearly operating here. A pattern of "polar amplification" of warming has been evident in surface air temperature records for decades (Hansen and Lebedev, 1987). Atmospheric circulation anomalies The NCEP/NCAR reanalysis data indicate warm airflow from the south over the southwestern part of the Greenland ice sheet (Fig. GL1).
Surface melt extent and duration The area and duration of melting on the ice sheet continued to expand in 2010, as compared with past years via daily passive microwave satellite remote sensing observations (Mote, 2007). April to mid-September (18 September) 2010 had about an 8% more extensive melt area than 2007, when the previous record maximum melt extent was observed (Figure GL2). The 2010 melt extent through mid September was 38% greater than the 1979-2007 average, and the June to August extent was 26% greater than average. .
Abnormal melt duration was concentrated along the western ice sheet (Figure GL3), consistent with anomalous warm air inflow during the summer (Figure GL1) and abnormally high winter air temperatures which led to warm pre-melt conditions. The melt duration was as much as 50 days greater than average in areas of west Greenland that had an elevation between 1200 and 2400 meters above sea level. In May, areas at low elevation along the west coast of the ice sheet melted up to about 15 days longer than the average. NCEP/NCAR Reanalysis data suggest that May surface temperatures were up to 5°C above the 1971–2000 baseline average. June and August also exhibited large positive melting day anomalies (up to 20 days) along the western and southern ice sheet. During August temperatures were 3°C above the average over most of the ice sheet, with the exception of the northeastern ice sheet. Along the southwestern ice sheet, the number of melting days in August has increased by 24 days over the past 30 years.
In May, areas at low elevation along the West coast of the ice sheet melted up to about 15 days longer than the average; June and August also show large positive melting day anomaly values (up to 20 days) along the West and South regions of the ice sheet. NCEP/NCAR Reanalysis data suggest that May surface temperatures were up to 5°C above the average. During August temperatures were 3°C above the average over most of the ice sheet, with the exception of the northeast ice sheet. Along the South-West portion of the ice sheet, the number of melting days in August has increased by 24 days over the past 30 years. In-situ observations from the K-Transect Ice sheet surface mass balance from September 2009-2010 was by far the lowest since 1990, when routine measurement began along an elevation transect of in-situ observations located near Kangerlussuaq at 67°N on the western flank of the ice sheet (van de Wal et al. 2005). Averaged over the 150-km long elevation K-transect, from 340 to 1500 meters above sea level, the surface mass balance was highly significant at 2.7 standard deviations below the 1990-2010 average. The altitude of the snow line (the extent of the melt of the winter snow cover) was higher than ever, with a very early onset of the melt season that continued until the beginning of September. Surface albedo values at the weather stations dropped below average and air temperatures in summer were above average. Marine-terminating glacier area changes Marine-terminating glaciers are of particular interest because they represent the outlets through which the ice can move most quickly and in the largest quantities out to the sea, contributing to rising average global sea levels and drawing down the inland ice reservoir. Glacier front ice area loss is also of concern because it is associated with reduced flow-resistance, which leads to accelerated ice loss from the inland ice. Daily surveys of Greenland ice sheet marine-terminating outlet glaciers, from cloud-free Moderate Resolution Imaging Spectroradiometer (MODIS) visible imagery (http://bprc.osu.edu/MODIS/), indicate that in the past year Greenland glaciers collectively lost an area of 419 km2. This is more than 3 times the loss rates of the previous 8 years, 2002-2009, which was 121 km2/year (Figure GL4). 7/10 of this year's loss came from the 290 km2 ice island detachment from Petermann glacier in far northwest Greenland (see: http://bprc.osu.edu/MODIS/?p=69). Glacier ice area loss elsewhere (i.e. outside the Petermann Glacier) remained near the 121 km2/year rate observed during the past decade. There is now clear evidence that the ice area loss rate of the past decade is greater than loss rates pre-2000.
A number of other large outlet glaciers also lost significant amounts of ice area: Zachariae Isstrøm in northeast Greenland lost 43 km2; Humboldt glacier in northwest Greenland lost 20 km2; Ikertivaq glacier in Southeast Greenland lost 15 km2; and the 5 glaciers that empty into Upernavik glacier bay in northwest Greenland lost 14 km2. Since 2000, the net area change of the 35 widest marine-terminating glaciers is -1535 km2; equivalent to an ice area loss 17.5 times the size of the 87.5 km2 Manhattan Island. The total effective glacier length change has been, on average, -1.7 km since year 2000. While the overall area change indicates the largest observed retreat, 7 of 35 glaciers did advanced in 2010 relative to 2009. The largest glacier advances were at Ryder and Storstrømmen glacier, each advancing 4.6 and 4.2 km2, respectively. Land-terminating glaciers are not part of our survey but most certainly lost a much smaller area because they are so much slower-moving than marine-terminating glaciers. Precipitation and surface mass balance The balance between snowfall gain and meltwater loss is positive for any healthy ice mass. In 2010, the MAR regional climate data assimilation model simulated that the ice sheet surface mass balance was 90% less positive than normal (Table GL2); the lowest net mass accumulation rate since 1958 when data to drive the model become available (Figure GL5). This condition reflects a very heavy melt year combined with below normal ice sheet snow accumulation. The high melt rate in 2010 was a consequence of:
The temperature and precipitation anomalies are very likely the result of regional circulation anomalies illustrated in Figure GL1. The main anomalies occur along the south-western margin where the number of days with bare ice was higher than normal. Compared to Summer 2007, where melt anomalies took place in both ablation and percolation zones (Tedesco et al., 2008), most of melt anomalies of this summer took place in the bare ice zone.
Anecdotal Data A long-term resident of Greenland wrote on 4 February, 2010: "we don´t have snow, we don´t have the cold" ... "This weather this year is really different, in 30 years that I live in Ilulissat [69.0°N along Greenland's west coast], that is the first year in this conditions. We have lot of dog sledding tourists, but we cannot do the tour, too much ice on the hills and dangerous to drive by sled." ... "no snow at all". Later, the same source remarked of "10-12 days of" continuous "heat wave" like weather, in June, with "a lot of blue skies". References Fettweis, X., G. Mabille, M. Erpicum, S. Nicolay, and M. Van den Broeke, 2010: The 1958-2009 Greenland ice sheet surface melt and the mid-tropospheric atmospheric circulation. Climate Dyn., doi:10.1007/ s00382-010-0772-8, in press. Hansen, J.E., and S. Lebedeff, 1987: Global trends of measured surface air temperature. J. Geophys. Res., 92, 13345-13372. Mote, T. L., 2007: Greenland surface melt trends 1973- 2007: Evidence of a large increase in 2007. Geophys. Res. Lett., 34, L22507, doi:10.1029/2007GL031976. Tedesco, M.: Snowmelt detection over the Greenland ice sheet from SSM/I brightness temperature daily variations, Geophys. Res. Lett., 34, L02504,doi:10.1029/2006GL028466, 2007. Tedesco, M., Serreze, M., and Fettweis, X.: Diagnosing the extreme surface melt event over southwestern Greenland in 2007, The Cryosphere, 2, 159-166, doi:10.5194/tc-2-159-2008, 2008. van de Wal, R. S. W., W. Greuell, M. R. van den Broeke, C.H. Reijmer and J. Oerlemans: Surface mass-balance observations and automatic weather station data along a transect near Kangerlussuaq, West Greenland, Annals of Glaciology, 42, 311-316, 2005. Printable Handout :: Executive Summary :: Full Arctic Report Card (PDF) |
|||||||||||||||||||||||||||||||||||||||||||||||||||||||
DOC | NOAA | NOAA Arctic Research Program |
 *Anomalies are in °C, with respect to the 1971–2000 base period. Bold values indicate values that meet or exceed 2 standard deviation2 from the mean. Red characters indicate a record setting year. The winter value takes December from the previous year.